
Statistical Analysis of the Artifacts in the FTCSG Assemblage
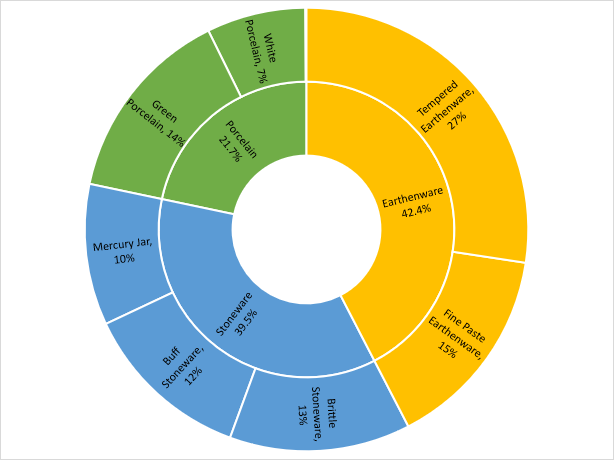
| Ceramics by Type of Material (Number of sherds) | |||
|---|---|---|---|
| Green Porcelain | 707 | Porcelain | 1064 |
| White Porcelain | 350 | ||
| Blue & White Porcelain | 7 | ||
| Mercury Jar | 502 | Stoneware | 1756 |
| Buff Stoneware | 608 | ||
| Brittle Stoneware | 646 | ||
| Tempered Earthenware | 1340 | Earthenware | 2075 |
| Fine Paste Earthenware | 735 | ||
| Total number of sherds | 4,895 | ||
Table 3. Types of ceramics (number of sherds)
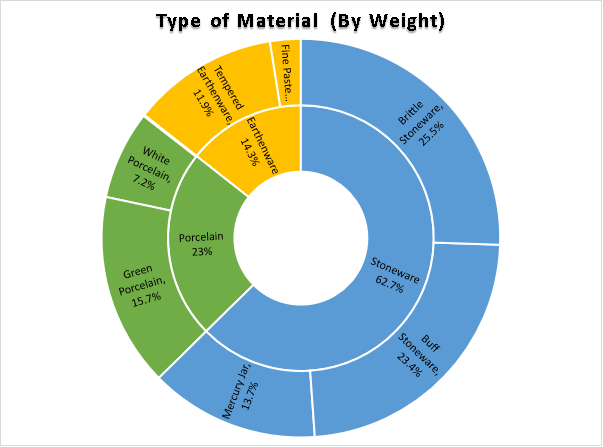
| Ceramics by Type of Material (Weight) | |||
|---|---|---|---|
| Green Porcelain | 7249 | Porcelain | 10635.5 |
| White Porcelain | 3351.5 | ||
| Blue & White Porcelain | 35 | ||
| Mercury Jar | 6358 | Stoneware | 28979 |
| Buff Stoneware | 10808 | ||
| Brittle Stoneware | 11813 | ||
| Tempered Earthenware | 1143.2 | Earthenware | 6840.3 |
| Fine Paste Earthenware | 5697.1 | ||
| Total weight (in grams) | 46,454.8 | ||
Table 4. Types of ceramics (weight)
*Points to note:
The greatest proportion of artifacts by number of sherds is earthenware, which is not surprising due to two reasons: 1) earthenware, being fired at a lower temperature, is more fragile and breaks easily into numerous small pieces, and 2) when the comparison is made by weight, earthenware forms the smallest percentage, as the clay body is thinner and less dense, so that earthenware vessels are more porous and lighter in weight than stoneware or porcelain of equal volume. Stoneware vessels, being larger storage jars and basins than earthenware, which are normally cooking pots and water jars, also weighed more per vessel.
Stoneware represents the second largest in percentage in terms of number of sherds, but the most in terms of weight largely because the stoneware vessels usually comprise large jars which weighed much more than earthenware jars and pots, and porcelain bowls, vases and jarlets (etc)..
Porcelain, being more highly prized, constituted the smallest proportion in both number of pieces and weight due to their more limited availability. In fact, it is rather interesting that high quality items among the porcelain sub-assemblage have been found at this location; these include rare types such as an iron-spotted Qingbai jarlet and a small number of blue and white sherds.
FTCSG Porcelain
Percentage of green porcelain, white porcelain, and blue and white porcelain in the FTCSG porcelain sub-assemblage:
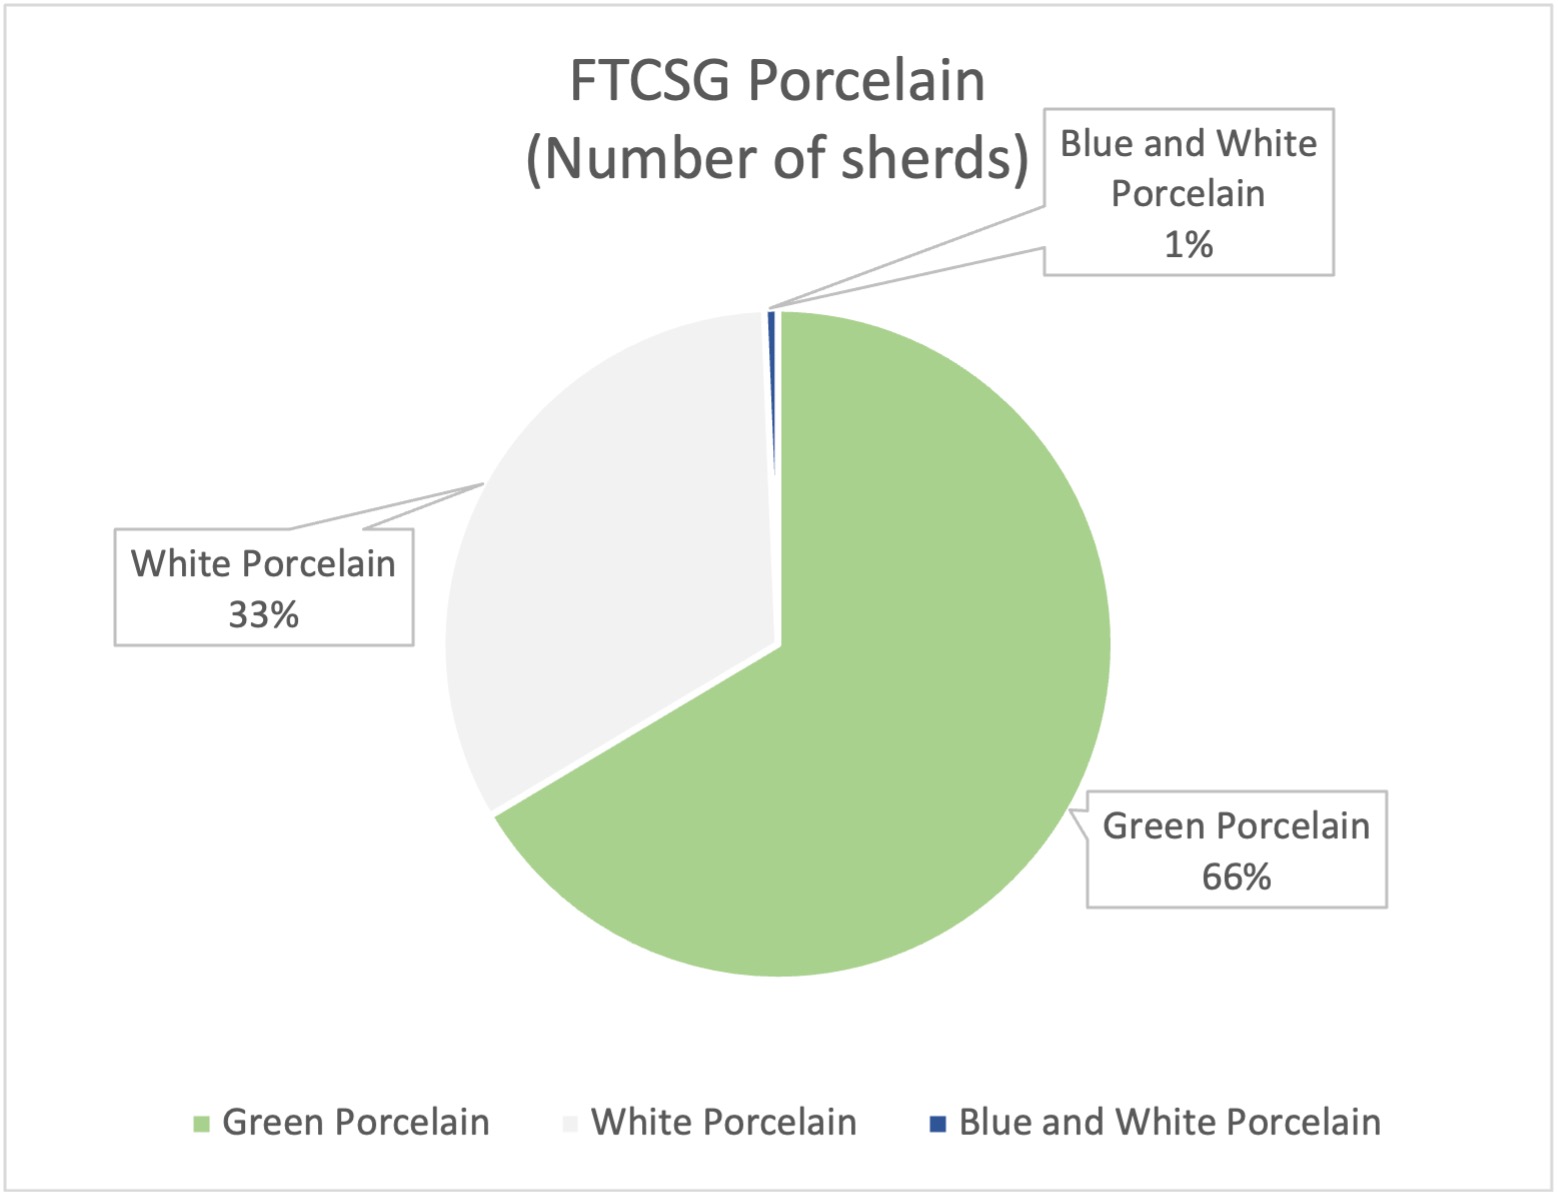
Number of sherds by type of porcelain:
- Green Porcelain: 707
- White Porcelain: 350
- Blue and White Porcelain: 7 = Total number of sherds: 1064
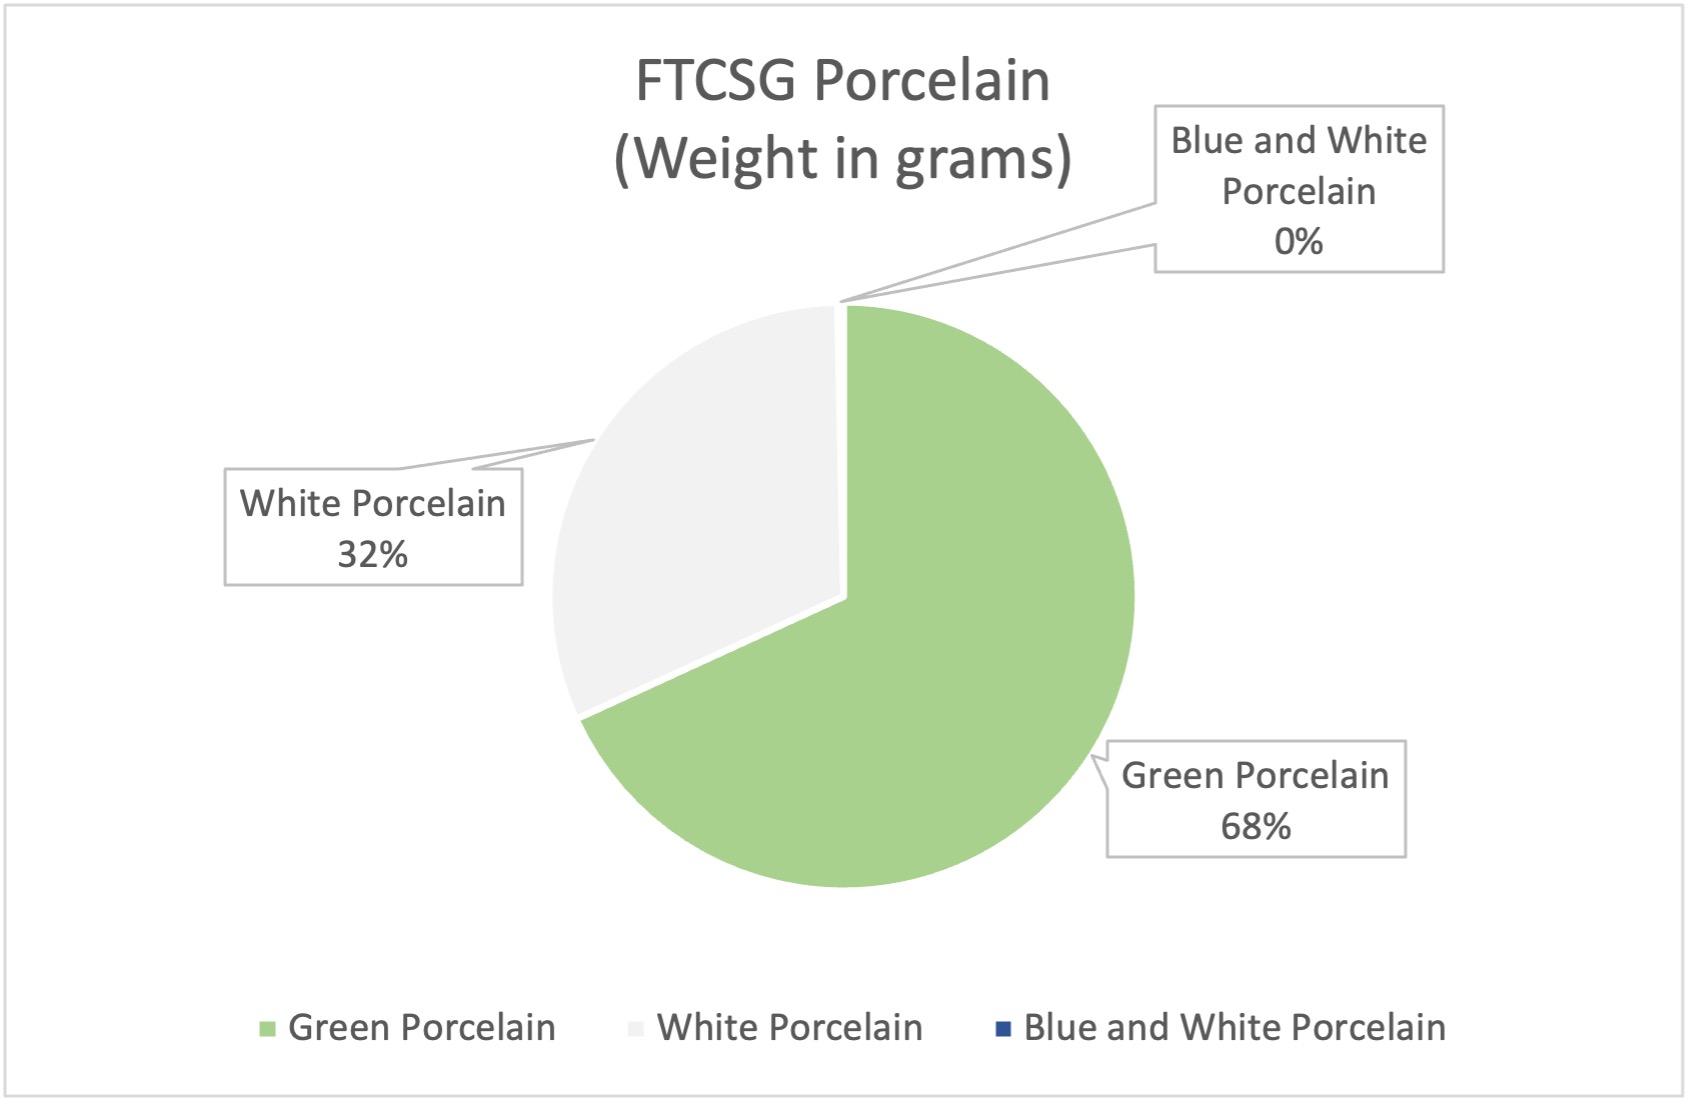
Weight by type of porcelain:
- Green Porcelain: 7,249 g
- White Porcelain: 3,351.5 g
- Blue and White Porcelain: 35 g
- Total weight: 10,635.5 g
Points to note:
The percentage of the proportion of gree, white, and blue and white porcelain is consistent with that of the Fort Canning assemblage of porcelain from the previous excavations conducted from 1984 to 1998 about 25 meters to the west. At that site, green porcelain appears to be the most numerous followed by white porcelain, with blue and white porcelain being rarest. These proportions are likely determined by the price and availability of the items; blue and white was probably more expensive and available in more limited supplies compared to the other two types of porcelain.
FTCSG Stoneware
Percentage of mercury jar, brittle stoneware and buff stoneware in the FTCSG stoneware sub-assemblage:
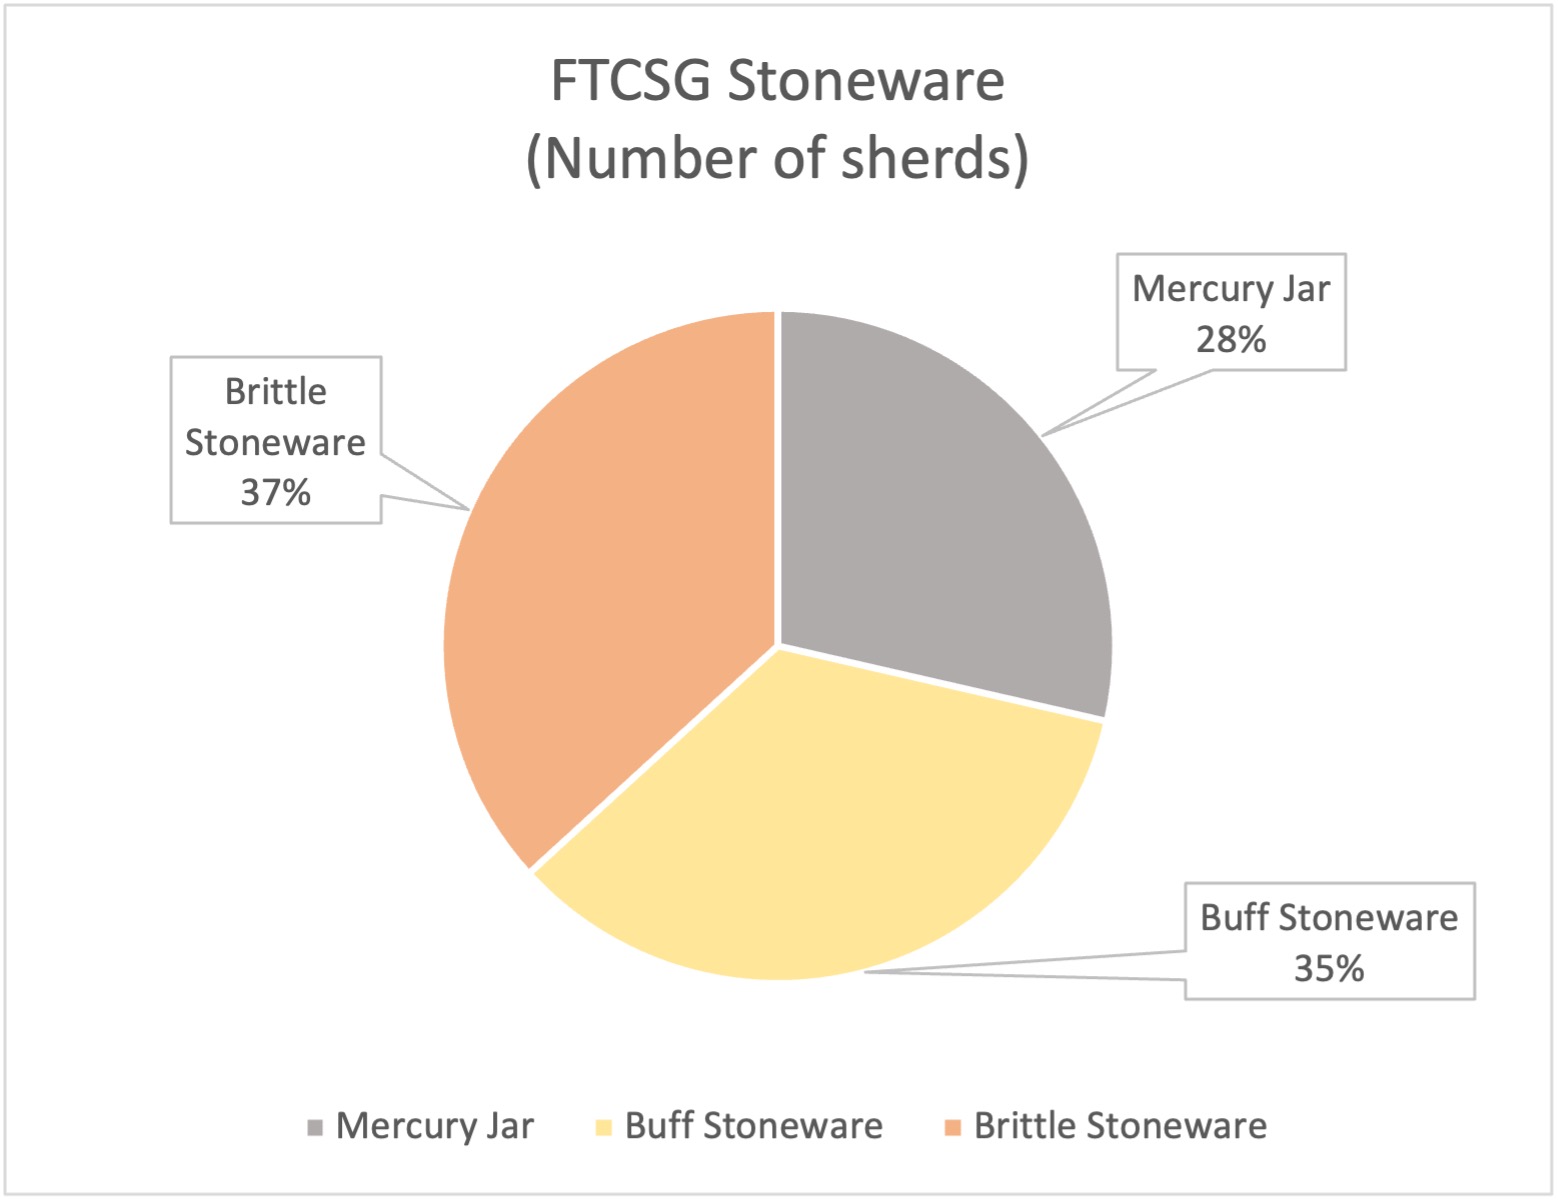
Number of sherds by type of stoneware:
- Mercury Jar: 502
- Buff Stoneware: 608
- Brittle Stoneware: 646
- Total number: 1,756
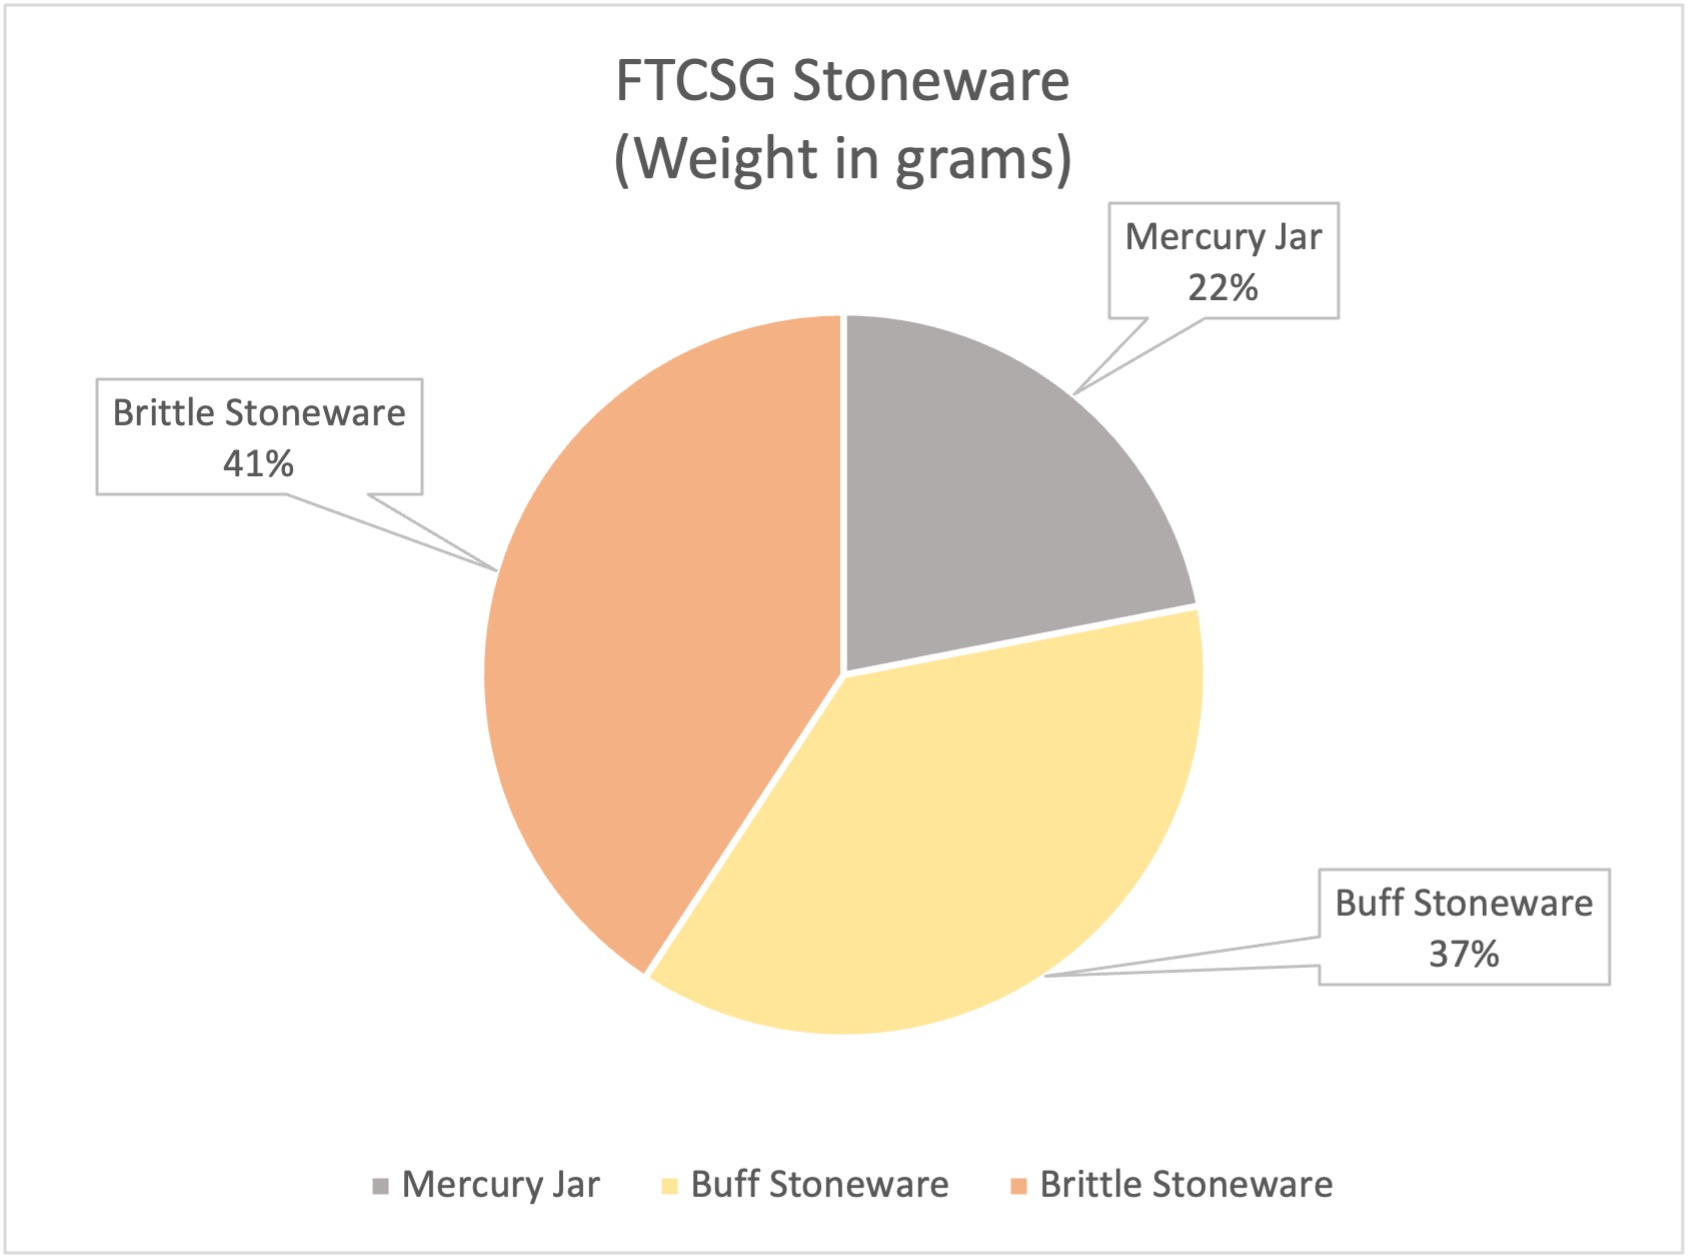
Weight by type of Stoneware:
- Mercury Jar: 6,358 g
- Buff Stoneware: 10,808 g
- Brittle Stoneware: 11,813 g
- Total weight: 28,979 g
Points to note:
Statistical analysis of the quantities (number of sherds) and weight of the stoneware sub-assemblage at the FTCSG site shows that mercury jars constitute the smallest category in terms of percentage of quantities in number of sherds and in weight. The proportion of brittle stoneware to buff stoneware in the FTCSG stoneware sub-assemblage shows a remarkable difference from the proportion between the two sub-types in the Fort Canning (FTC) and other Singapore sites, where buff stoneware constitutes the largest proportion in terms of number of sherds and in weight, followed by brittle stoneware, and mercury jar. This difference in relative quantities may be indicative of sampling error as these differences are only 1 percent by number of sherds and 1.1 percent in terms of weight. The largest number of brittle stoneware by sherds was found in Square IV in the dense heap of artifacts which is interpreted as a possible dumping spot for rubbish along the footpath.
FTCSG Earthenware
Percentage of fine paste earthenware and tempered earthenware in the FTCSG earthenware sub-assemblage:
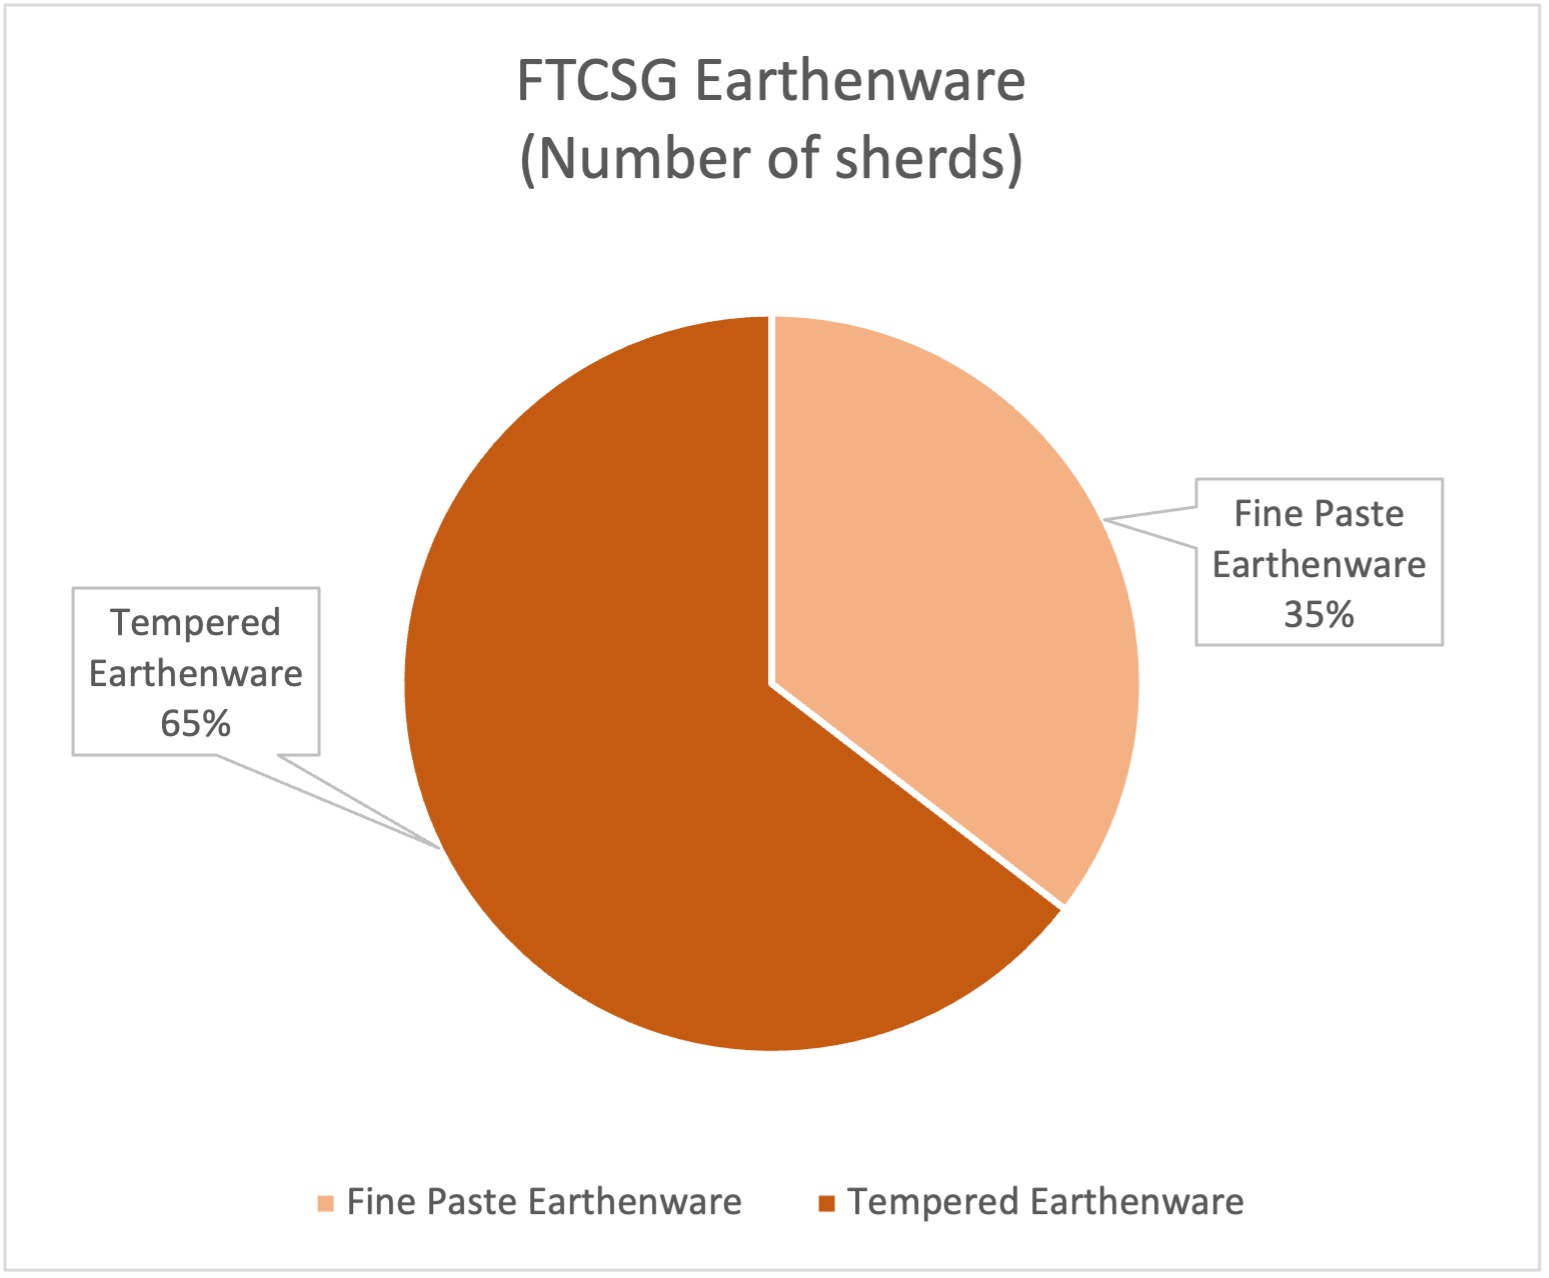
Number of sherds by type of earthenware:
- Fine Paste Earthenware: 735
- Tempered Earthenware: 1,340
- Total number of sherds: 2,075
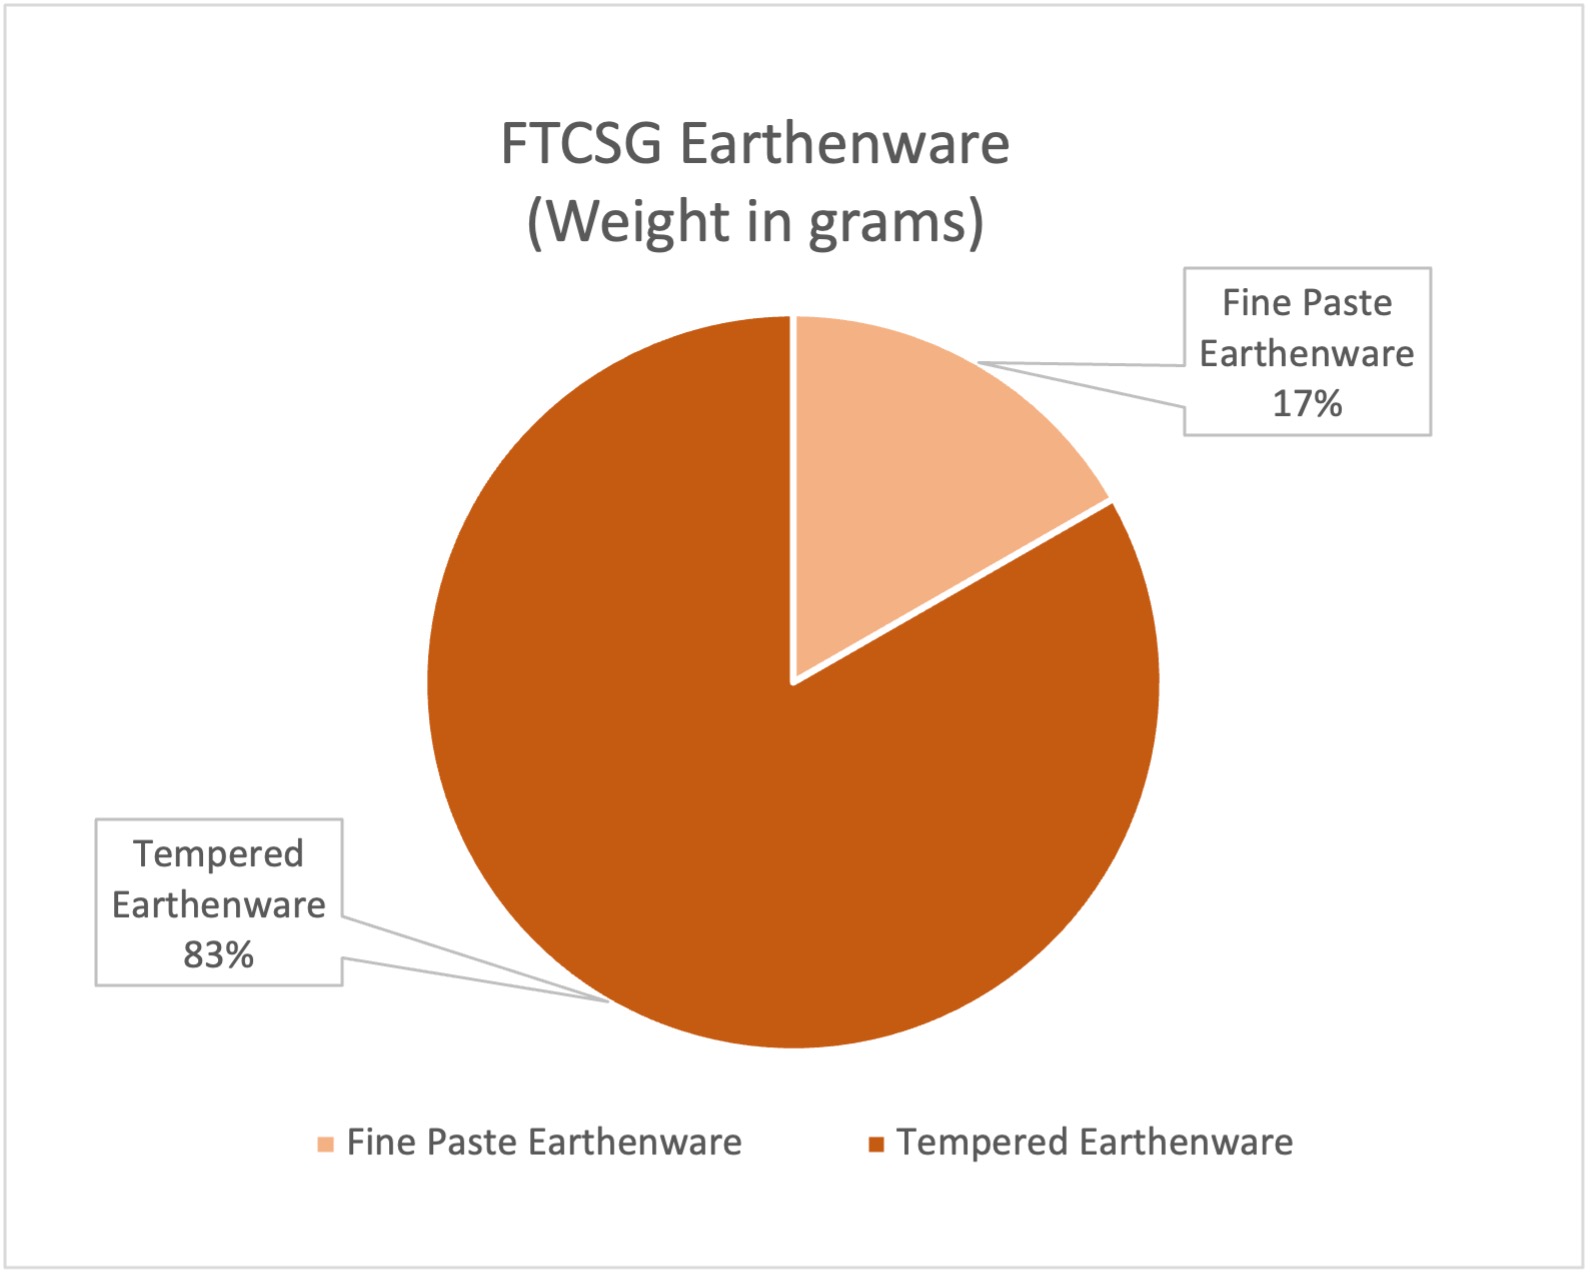
Weight by type of earthenware:
- Fine Paste Earthenware: 1,143.2 g
- Tempered Earthenware: 5,697.1 g
- Total weight: 6,6840.3 g
The proportions of fine paste and tempered earthenware are consistent with the distribution of the two types of earthenware at the Fort Canning site (FTC) and other Singapore sites. Fine paste ware is an imported type, probably from southern Thailand. It is more fragile than tempered earthenware, and was probably used in more ritual contexts than tempered ware, which was mainly used for cooking and food storage.
FTCSG 19th to 20th-Century Artifacts
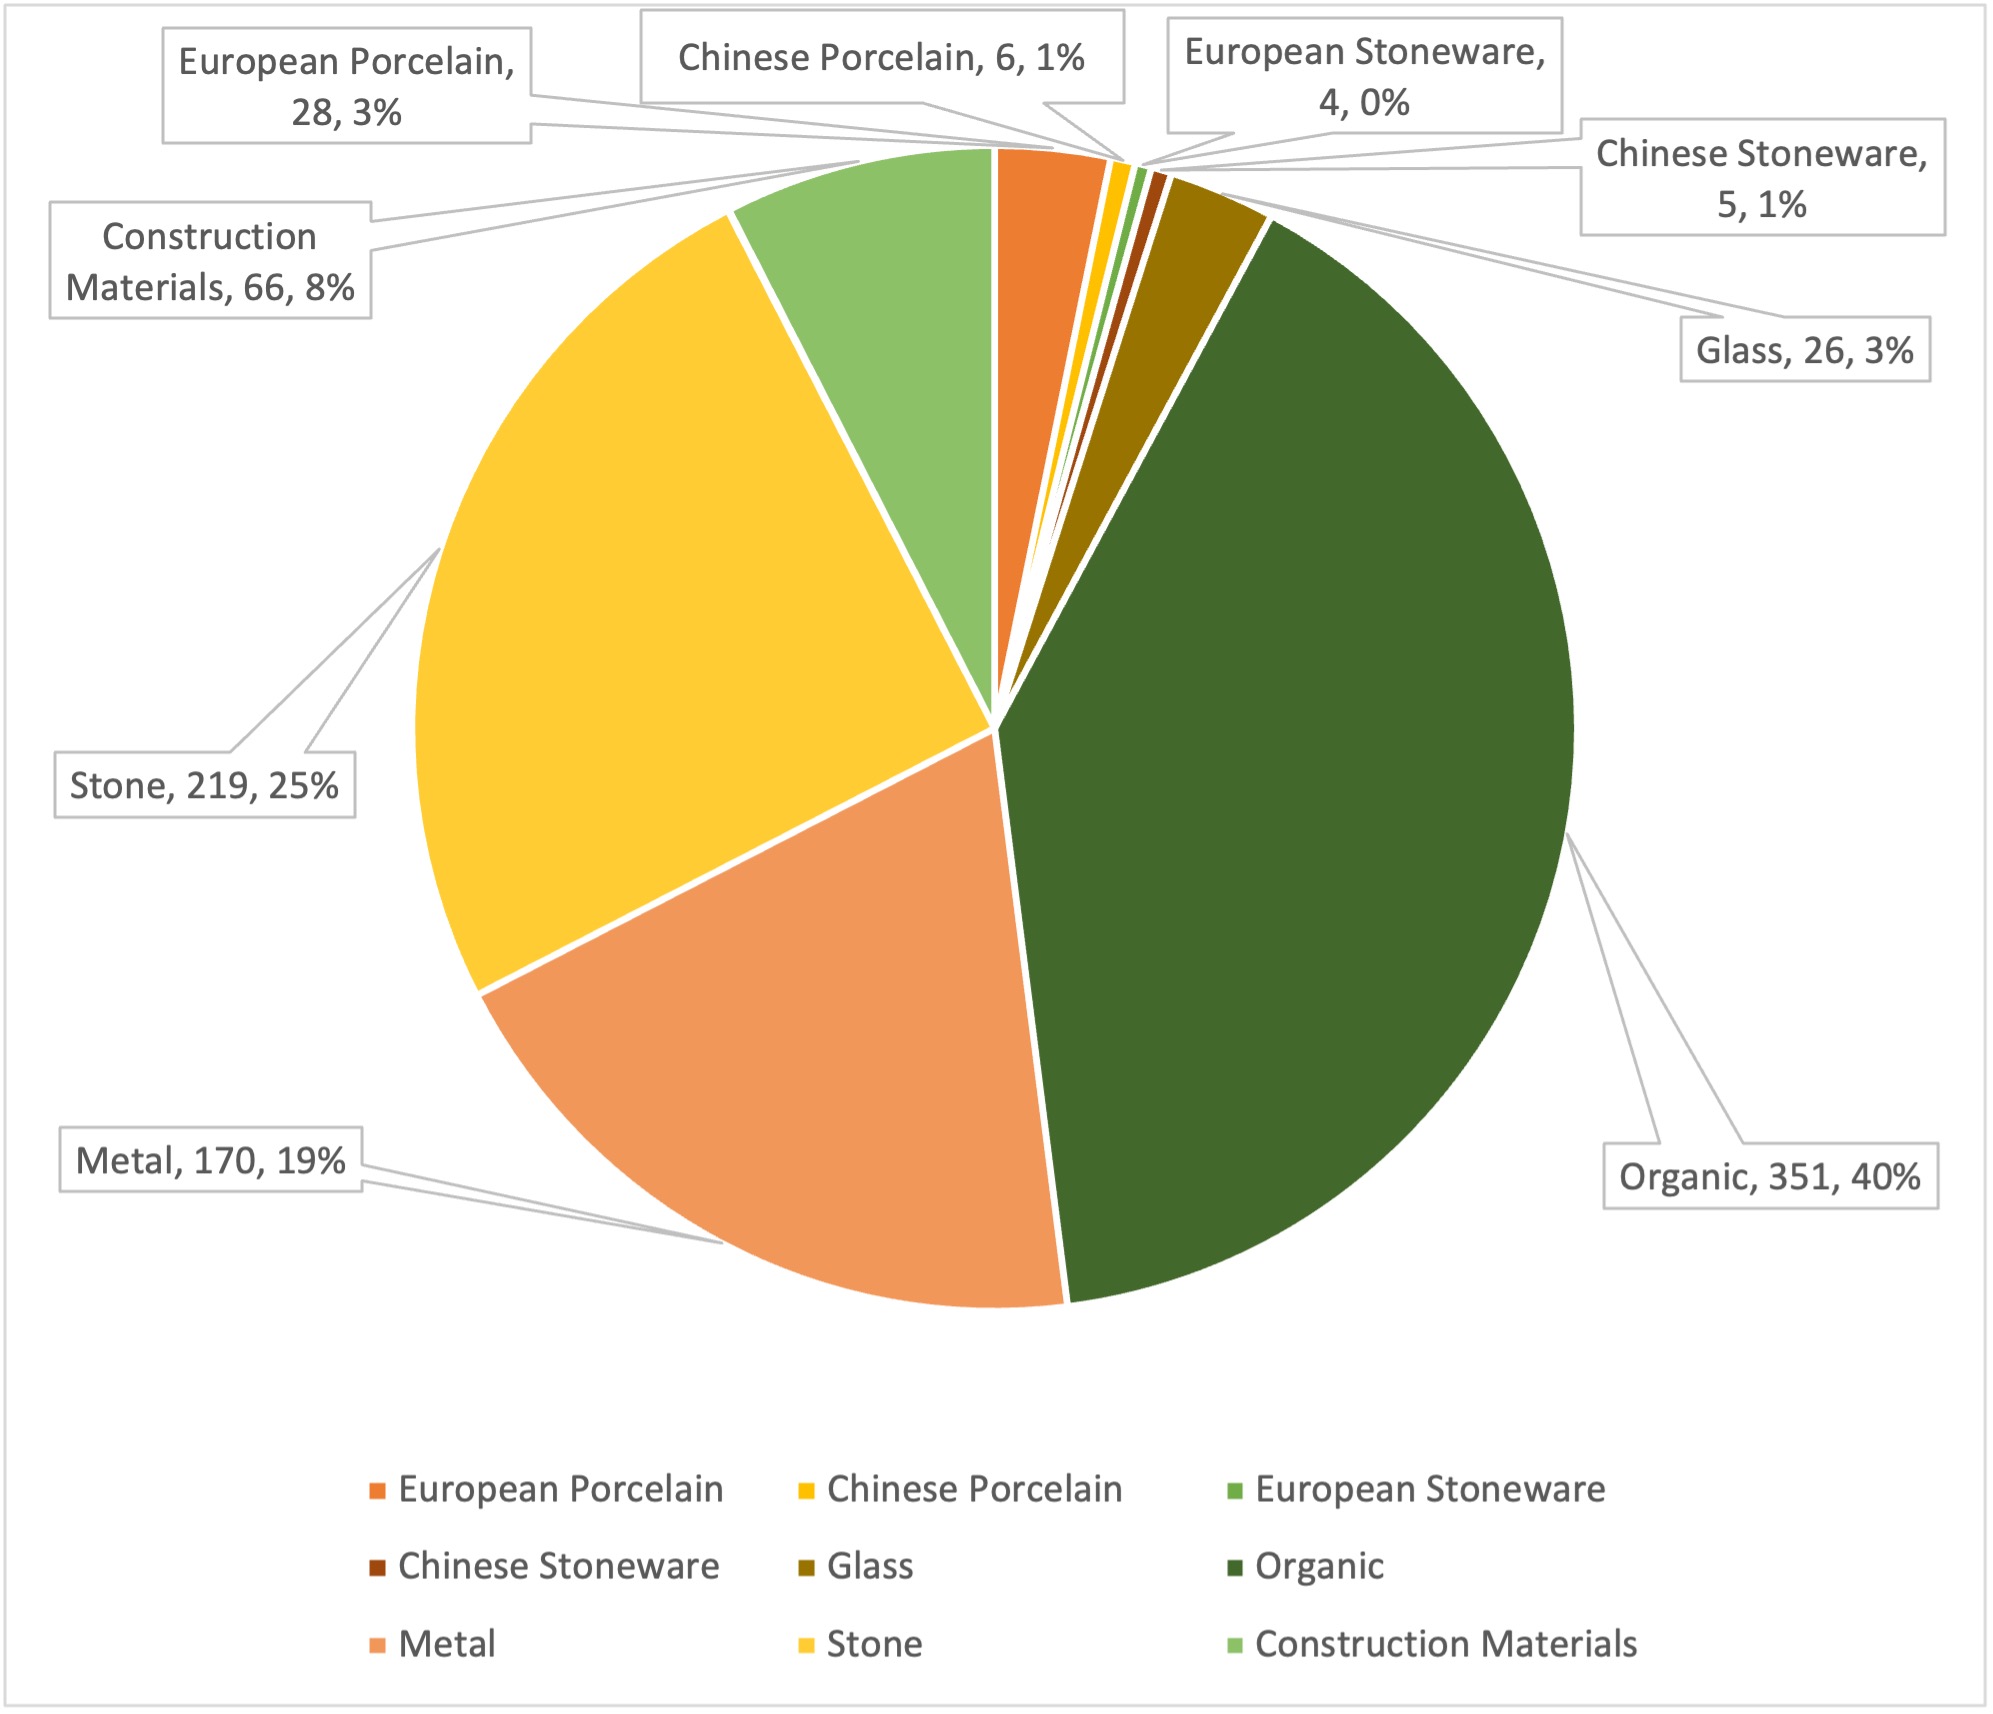
| Ceramics by Type of Material (Number of pieces) | |||
|---|---|---|---|
| European Porcelain | 28 | Ceramics | 43 |
| Chinese Porcelain | 6 | ||
| European Stoneware | 4 | ||
| Chinese Stoneware | 5 | ||
| Glass | 26 | Non-ceramics | 832 |
| Organic | 351 | ||
| Metal | 170 | ||
| Stone | 219 | ||
| Construction Materials | 66 | ||
| Total number of pieces | 875 | ||
Table 5. Types of 19th to 20th century artifacts (number of sherds)
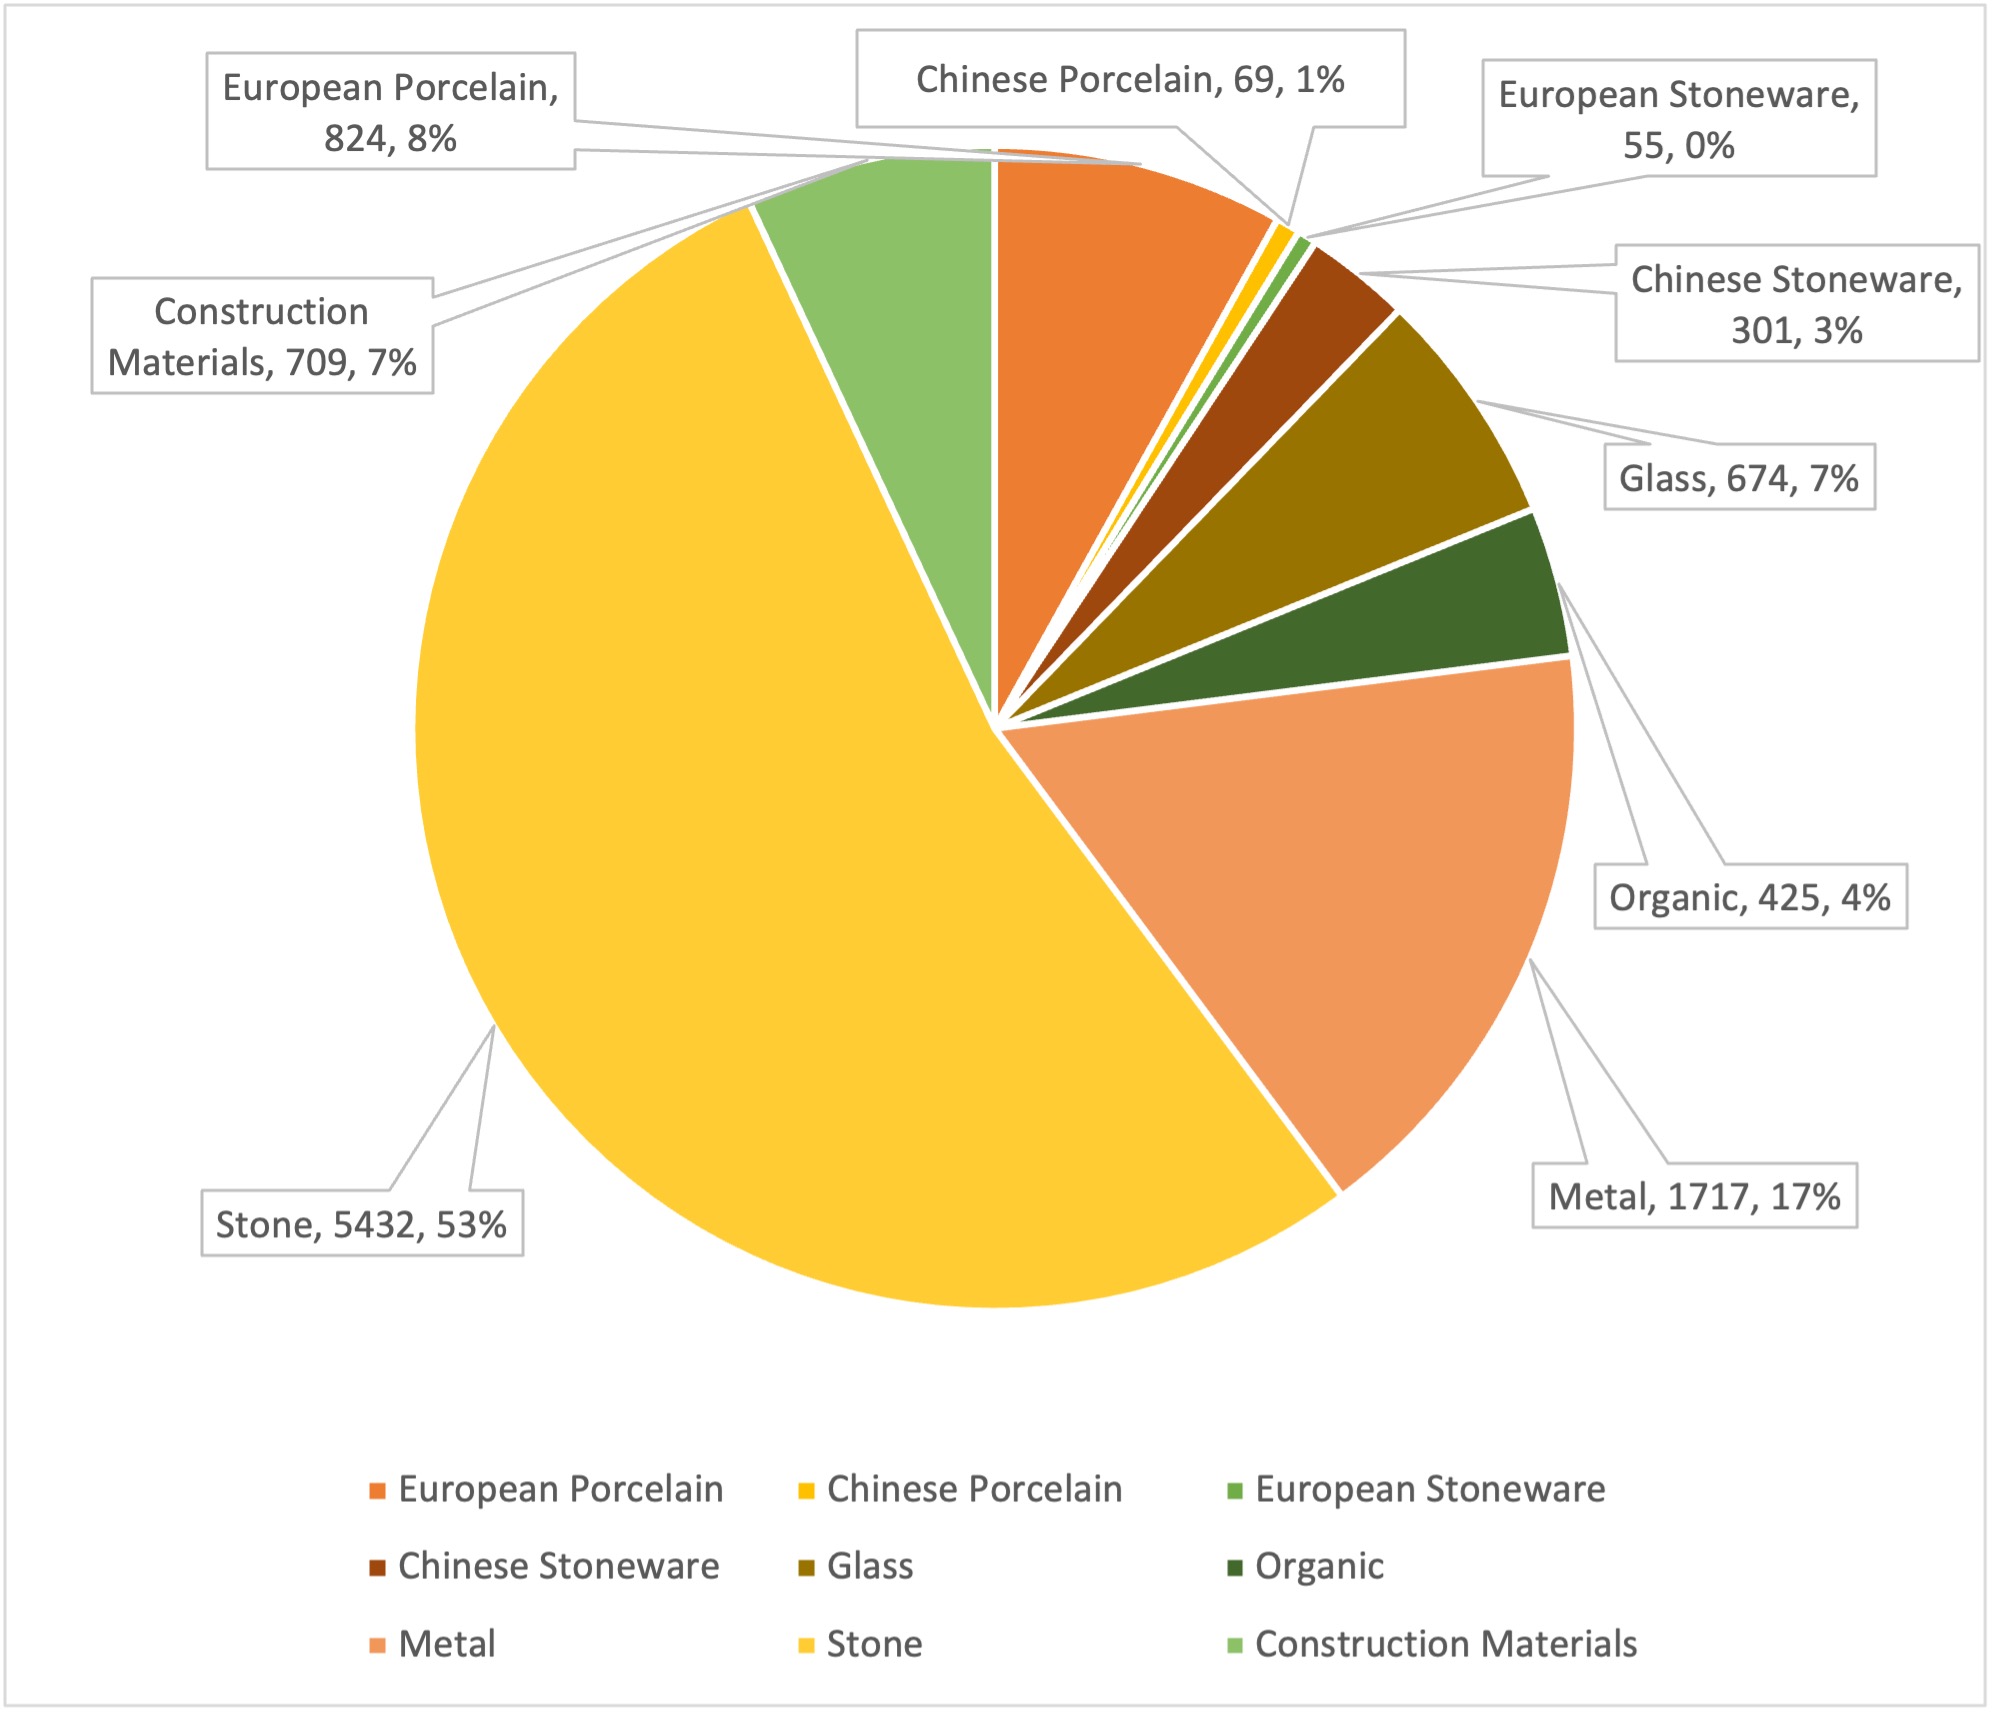
| Ceramics by Type of Material (weight in grams) | |||
|---|---|---|---|
| European Porcelain | 824 | Ceramics | 1249 |
| Chinese Porcelain | 69 | ||
| European Stoneware | 55 | ||
| Chinese Stoneware | 301 | ||
| Glass | 674 | Non-ceramics | 8957 |
| Organic | 425 | ||
| Metal | 1717 | ||
| Stone | 5432 | ||
| Construction Materials | 709 | ||
| Total weight in grams | 10,206 | ||
Table 6. Types of 19th to 20th century artifacts (by weight in grams)